Reading a Candlestick Chart for Beginners
Learn how to read a candlestick chart for beginners, including key features and patterns.
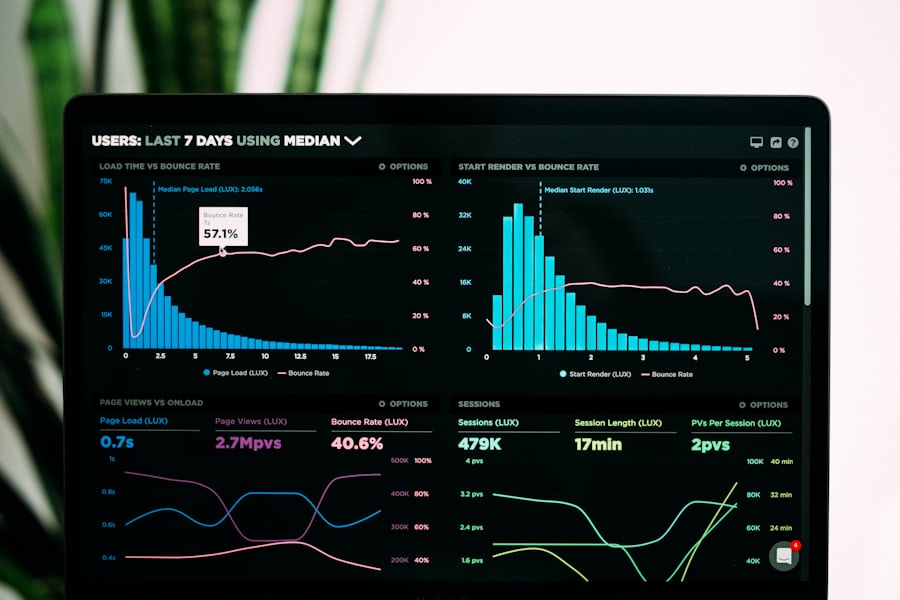
Understanding Candlestick Charts
A candlestick chart displays price movements over a specific period and is pivotal for analyzing market trends. Each candlestick represents four critical price points: open, close, high, and low. Mastering these elements is essential for any beginner.
Components of a Candlestick
Each candlestick contains:
- Open: The price at which an asset starts trading during a specific time period.
- Close: The price at which the asset ends trading for that period.
- High: The highest price reached during that time frame.
- Low: The lowest price reached during that time frame.
These components are visually represented using a rectangular body and two lines called wicks (or shadows).
Candlestick Structure
- Bullish Candle: This occurs when the close price is higher than the open price, often represented as a white or green body.
- Bearish Candle: This happens when the close price is lower than the open price, typically shown with a black or red body.
Understanding the color of the candle is crucial; it indicates market sentiment during that period.
How to Read a Candlestick Chart
1. Identify the Time Frame: Different traders use varying time frames, including minutes, hours, days, or weeks.
2. Examine the Body and Wicks: A long body indicates strong buying or selling pressure, while small bodies signify indecision. Wicks reflect the price action during the period.
3. Look for Patterns: Familiarize yourself with common candlestick patterns, which can suggest potential price movements.
- Doji: Indicates indecision in the market; the open and close prices are very close.
- Hammer: Signals a potential bullish reversal after a downward trend.
- Shooting Star: Suggests a potential bearish reversal after an upward trend.
Common Candlestick Patterns
As you get comfortable with reading a candlestick chart for beginners, pay attention to key patterns:
- Morning Star: A bullish trend reversal pattern signifying a potential upward movement.
- Evening Star: A bearish trend reversal pattern indicating a possible downtrend.
- Engulfing Patterns: Bullish and bearish patterns that indicate strong buying or selling pressure based on one candle engulfing another.
Tips for Beginners
- Practice Regularly: The more you analyze different candlestick charts, the better you will understand market sentiment.
- Use Additional Tools: Pair candlestick chart analysis with other indicators like moving averages or RSI (Relative Strength Index) to enhance your analysis.
- Stay Informed: Keep an eye on market news, as events can significantly impact price movements.
Key Takeaways
- A candlestick chart visually represents price movements of assets across specific time intervals.
- Each candlestick denotes bullish or bearish trends based on the open, close, high, and low prices.
- Understanding candlestick patterns can greatly enhance trading strategies and market analysis.
Being proficient at reading a candlestick chart for beginners requires practice and observation. Track your learning curve and incorporate feedback to hone your skills.
*This content is for educational purposes only and does not constitute financial advice.*